Learn how a recruitment website CMS boosts employer branding, streamlines candidate journeys, and converts more applicants with automation and analytics.
Learn how a recruitment website CMS boosts employer branding, streamlines candidate journeys, and converts more applicants with automation and analytics.

Discover how to design an employer career site builder for hiring managers to streamline approvals, boost engagement, and speed up hiring. Learn more here!

Discover how recruitment website add-ons lift staffing ROI with automation, analytics and widgets that attract, engage and convert quality talent.
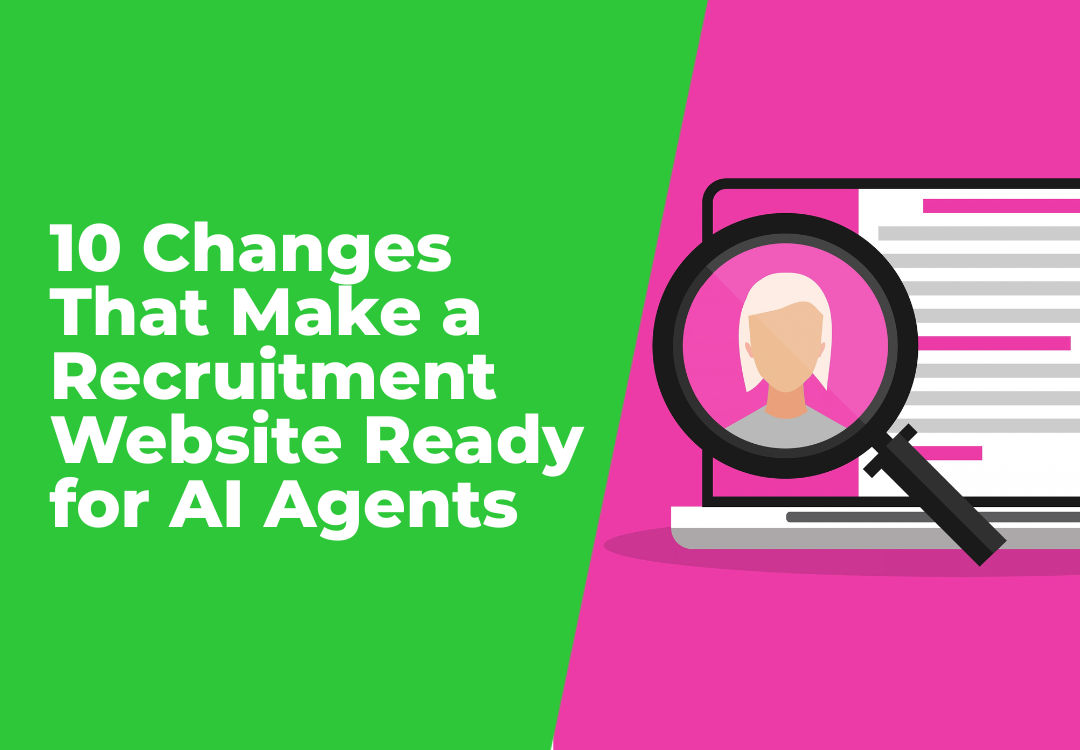
Learn what makes a recruitment website agent-ready, from semantic HTML and accessible controls to structured job data, privacy safeguards and human review.

Stop Publishing Panic with Safer Recruitment Webflows A high-traffic job campaign goes live, applications start pouring in, and then someone spots it: the wrong salary band, a broken apply button, or outdated compliance text on every ad. In peak Q4 hiring season, that kind of mistake is not just annoying; it is risky for your brand and your revenue. One bad publish can waste budget, confuse candidates, and spark a stressful scramble across the team. Publishing risk is rising because recruitment teams are pushing out more content across more channels with tighter deadlines and smaller teams. Job ads, landing pages, employer brand stories, seasonal hiring pushes, all moving fast at once. When the workflow behind that content is loose, risk sneaks in. A recruitment website CMS with clear roles, approvals, and QA steps turns this chaos into a safer, repeatable process. Workflow automation cuts risk without slowing recruiters down. That is what we focus on at Shazamme, building recruitment-first tools that keep your webflows controlled, even when hiring goes into overdrive. Mapping the Modern Recruitment Web Team Before you can fix publishing risk, you need to know who actually touches the CMS. Most recruitment and staffing teams now share content duties across several roles: Recruiters and resourcers Talent marketers and digital specialists Content editors or copywriters Hiring managers and business leaders Legal or compliance reviewers Brand or marketing leadership Each group should have clear responsibilities and handoffs. For example: Recruiters draft job copy, confirm role requirements, and set target locations Hiring managers validate salary ranges, benefits, and reporting lines Talent marketers shape headlines, calls to action, and visuals Legal or compliance reviewers check DEI and privacy text, and any regulated language Brand owners sign off on big campaigns, new sectors, or new markets When this is not mapped, problems creep in fast. You might see duplicate job posts competing in search, inconsistent remote-work tags, or old employer brand messaging showing next to new content. Seasonal requisitions for holidays or end-of-year pushes can miss their launch window because nobody knew who had final say. A recruitment-focused CMS should let you mirror that real-world structure. Role-based permissions keep people in their lane, so recruiters can update jobs without touching global templates, and legal can review only the content that needs their eye. Custom approval paths by brand, sector, or country help larger teams avoid endless email threads about who owns what. Dashboards that show which stage each piece of content sits in mean fewer “who has this now?” messages. Designing Low-Risk Approval Flows in Your CMS Once roles are clear, you can design approval flows that match the level of risk for each content type. Not every change needs a full parade of sign-offs. That is where smart workflow design comes in. Think in content types: Job ads and job templates Seasonal hiring campaign pages Sector or practice area content Employer brand stories, culture pages, and blogs Then match each type to an approval rule: Fast-track for low-risk tweaks like typo fixes or image swaps Single approval for standard job posts that follow set templates Multi-step approval for anything with compliance-heavy language, like privacy text or DEI statements Extra checks for salary transparency in locations with strict rules Automation does the heavy lifting. Routing sends a draft to the right approver as soon as it is ready. Reminders nudge people as launch dates get close. Escalation rules help when someone is on leave, so jobs do not sit stuck in limbo. Version history lets you roll back last-minute mistakes without starting from scratch. On a platform built for recruitment, like Shazamme, these flows can be templated for agencies and in-house teams. Integrations with your ATS or CRM reduce manual copy-paste, which is a common source of errors. Approvals can be aligned to your hiring calendar, so those large Q4 campaigns follow stricter flows than a basic evergreen role. QA Checklists and Automation That Catch Hidden Risks Even with the best workflow, humans miss things. That is why a layered QA setup inside your recruitment website CMS is so helpful. Think of it as your safety net before anything reaches candidates. Core QA layers usually include: Content checks: titles, locations, salary ranges, work type, and job references UX checks: mobile layout, application flow, and load speed Technical checks: broken links, missing tracking tags, or incorrect redirects Automation can cover a lot of the boring but important checks: Link checkers that scan pages for broken or misdirected URLs Required fields for must-have data like job location or reference number Built-in spell-check and style checks on common brand phrases Standardized, locked components for legal disclaimers and EEO language Pre-launch testing environments are another big win. A staging site or preview links let recruiters, marketers, and hiring managers walk through seasonal campaigns or bulk job updates as if they are live. You can test new widgets or salary tools without real candidates bumping into half-finished pages. Shazamme focuses on recruitment-specific tools here: reusable job and salary widgets, pre-approved content blocks, and candidate-facing chatbots that can be added safely inside templates. Analytics dashboards then help you spot odd patterns like a sudden drop in application rates on a new campaign, which often signals a broken step in the flow. Turning Analytics Into Workflow Improvements Once campaigns are live, your analytics are not just about performance. They are feedback on how well your workflow is working. Over time, that data will show you where risk hides and where delays start. Useful metrics to watch include: Time from draft to publish by content type Volume of edits made after go-live Error rate, such as broken links or bad salary data found in QA Application conversion during busy hiring periods compared to quieter times When you segment by role, brand, or region, patterns show up. Maybe one team needs more training on remote-work tags, or a certain approval step always blocks time-sensitive roles. In some areas, you might see that you can safely remove a layer of sign-off. In others, you may want an extra review for compliance-heavy content. Because Shazamme includes analytics and marketing automation in the same platform as the CMS, you can connect these dots. If performance dips on a key job family, that can trigger a content review task. Templates that always perform well can become your standard. Over time, your workflow gets cleaner, leaner, and safer. Launch Safer Campaigns with a Future-Ready CMS Playbook The core blueprint for a low-risk recruitment website CMS is simple: clearly defined roles, right-sized approval paths, and a layered QA system that lives inside your publishing tools. When these three pieces work together, your team can push hard on big hiring campaigns without holding their breath every time someone hits publish. A practical 30 to 60 day plan might look like this: Audit your current workflows and note where things stall or go wrong Map who actually touches content and what they should own Design or refine approval rules for jobs, campaigns, and brand content Build a standard QA checklist and automate as much of it as possible Pilot the new process on an upcoming seasonal or high-volume hiring push From there, it becomes easier to see if your current platform really supports that level of control. Some tools are built for general content, not for the specific demands of recruitment and staffing. At Shazamme, we design for the way agencies and employers actually run hiring, from custom websites to automation, analytics, and integrations, all tuned to reduce publishing risk without slowing your team down. Get Started With Your Project Today If you are ready to attract better candidates and clients, our recruitment website CMS gives you the control and flexibility you need. At Shazamme, we work with you to design, launch, and optimize a site that truly supports your recruiting workflows. Share your goals with our team and we will map out the best approach for your next upgrade. If you are ready to move forward, contact us and we will help you get started.

Use a practical framework for recruitment website analytics to track speed, search, & apply flow, improving candidate experience & cutting cost per applicant.